Historical Changes
Walsall's population has changed significantly over time. The below graph shows the change between 1991-2016 in estimated population. In 90s - 2000s Walsall's population was in decline, reaching a minimum in 2001. This was predominantly a fall in the working age population, as reflected in the dependency ratio: defined as the number of dependents, under 15 or over 65, to every 1 working age adult. Since 2001 the population has risen significantly - 9% in 15 years. The dependency ratio has continued to rise, in-line with population, and above the national average - accounted for by a continued rise in the elderly population.
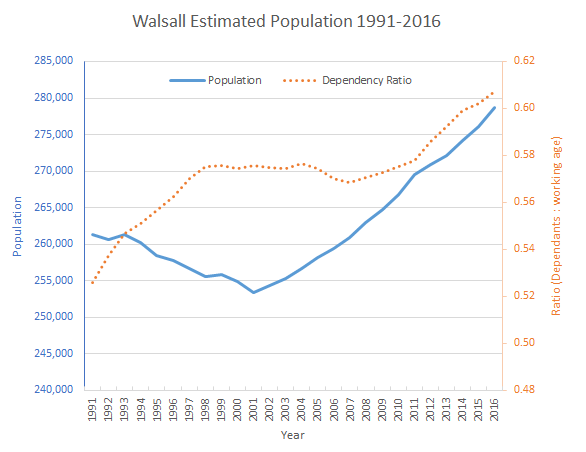
Source: ONS Mid-year estimates
Population Distribution
The below graph shows an overview of the concentration of young & older people across the borough's wards. The data has been normalised in order to rank the boroughs based on how they compare to one another I.e. Palfrey has the highest under 16s population and so appears furthest from the centre of the chart. Wards with the smallest populations will appear closer to the centre (e.g. Pelsall under 16s).
We can see a clear picture: Streetly ranks top of the over 65s category, closely followed by Aldridge, then Pelsall: the distribution is very much focused in the East. These are the more affluent areas of Walsall.
In contrast, the younger population is focused predominantly in areas within the North, South & West: Palfrey, Blakenall & Pleck - typically more deprived wards.
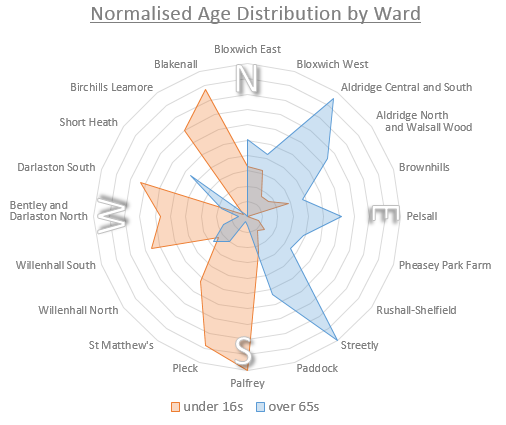
Source: ONS Mid-year estimates