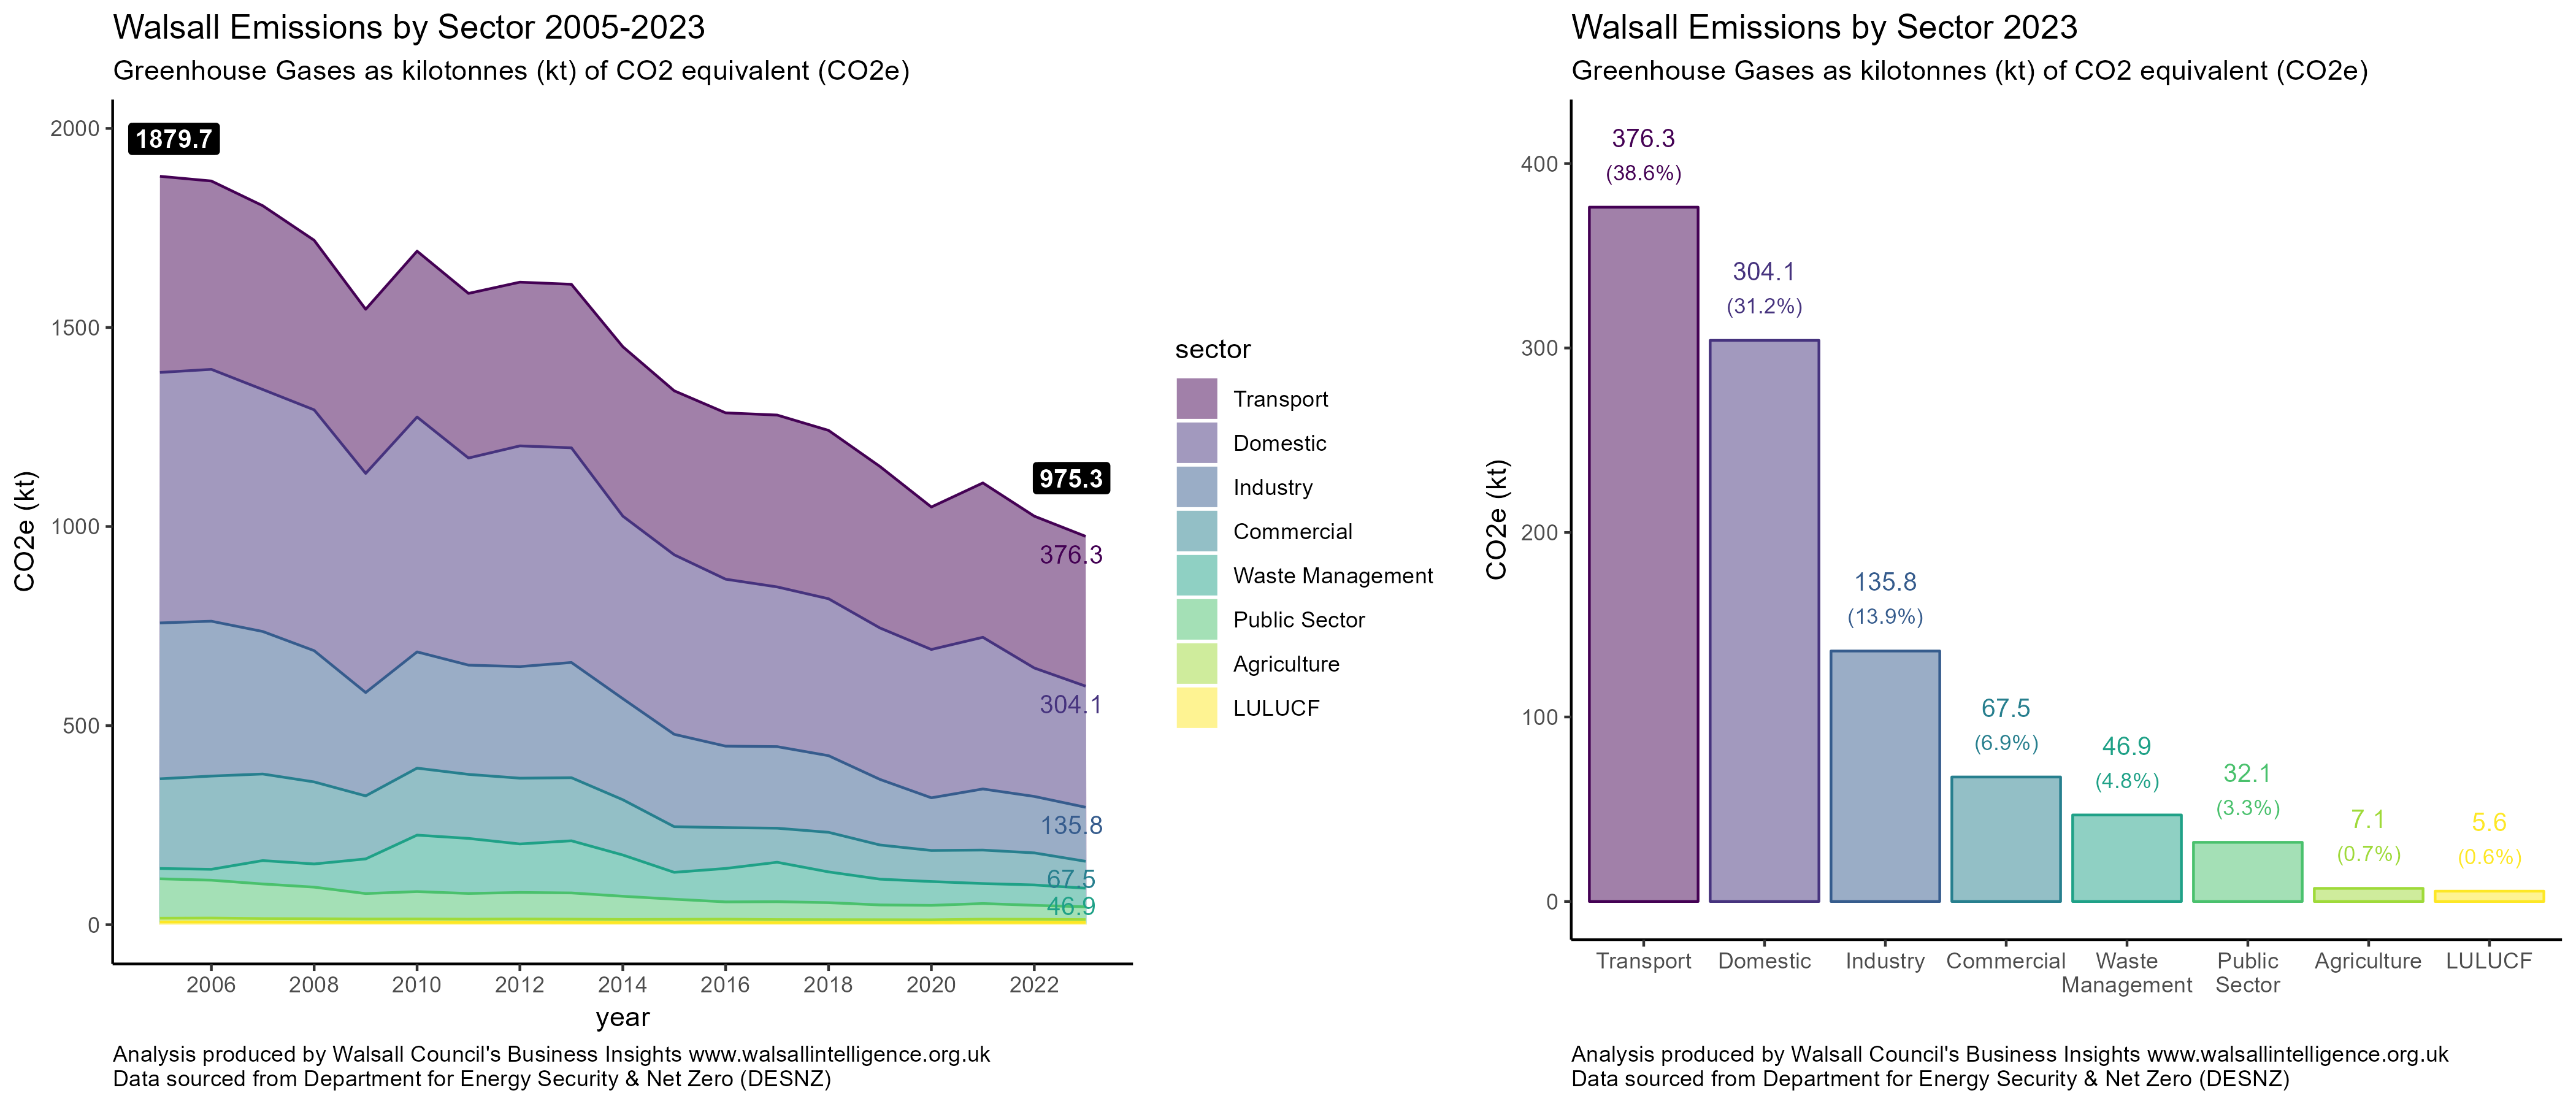
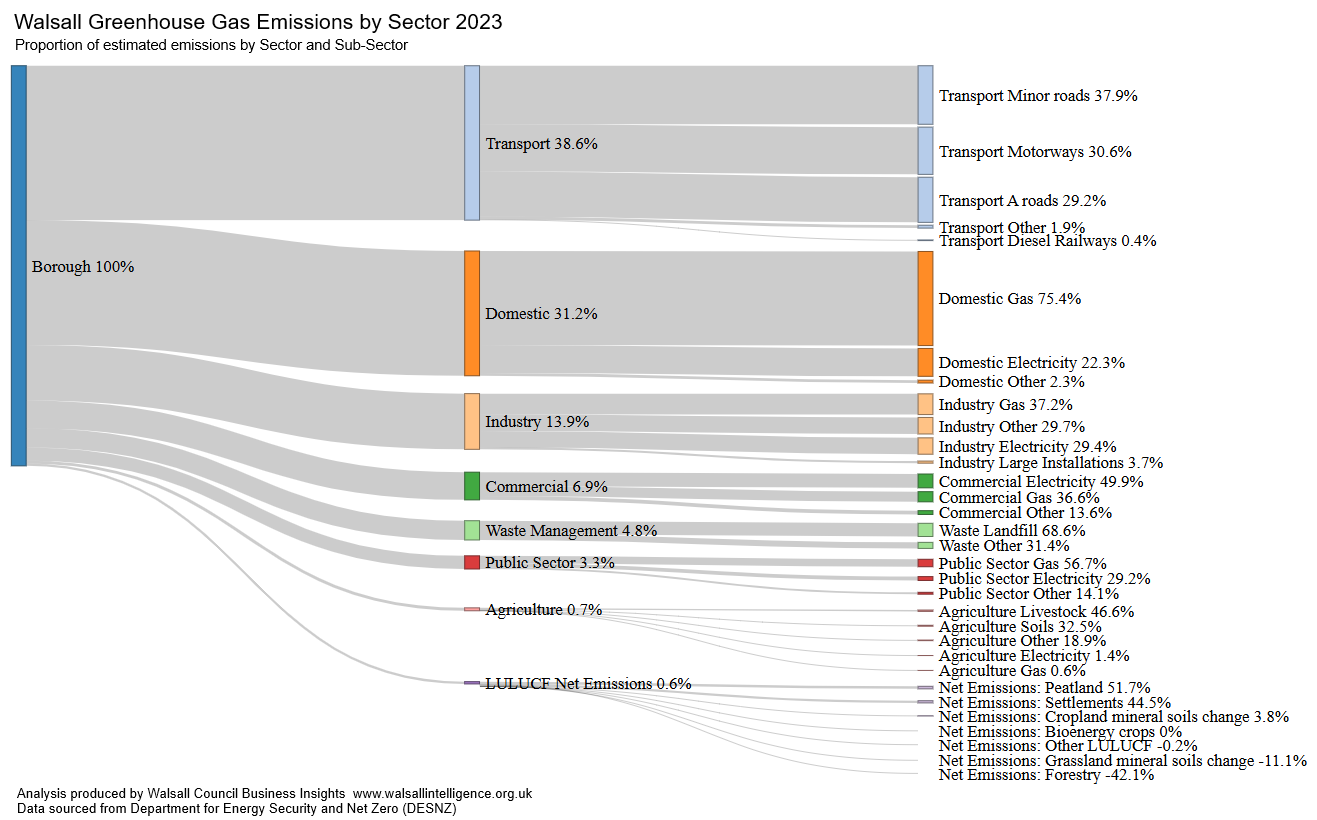
Greenhouse Gas Emissions in Walsall
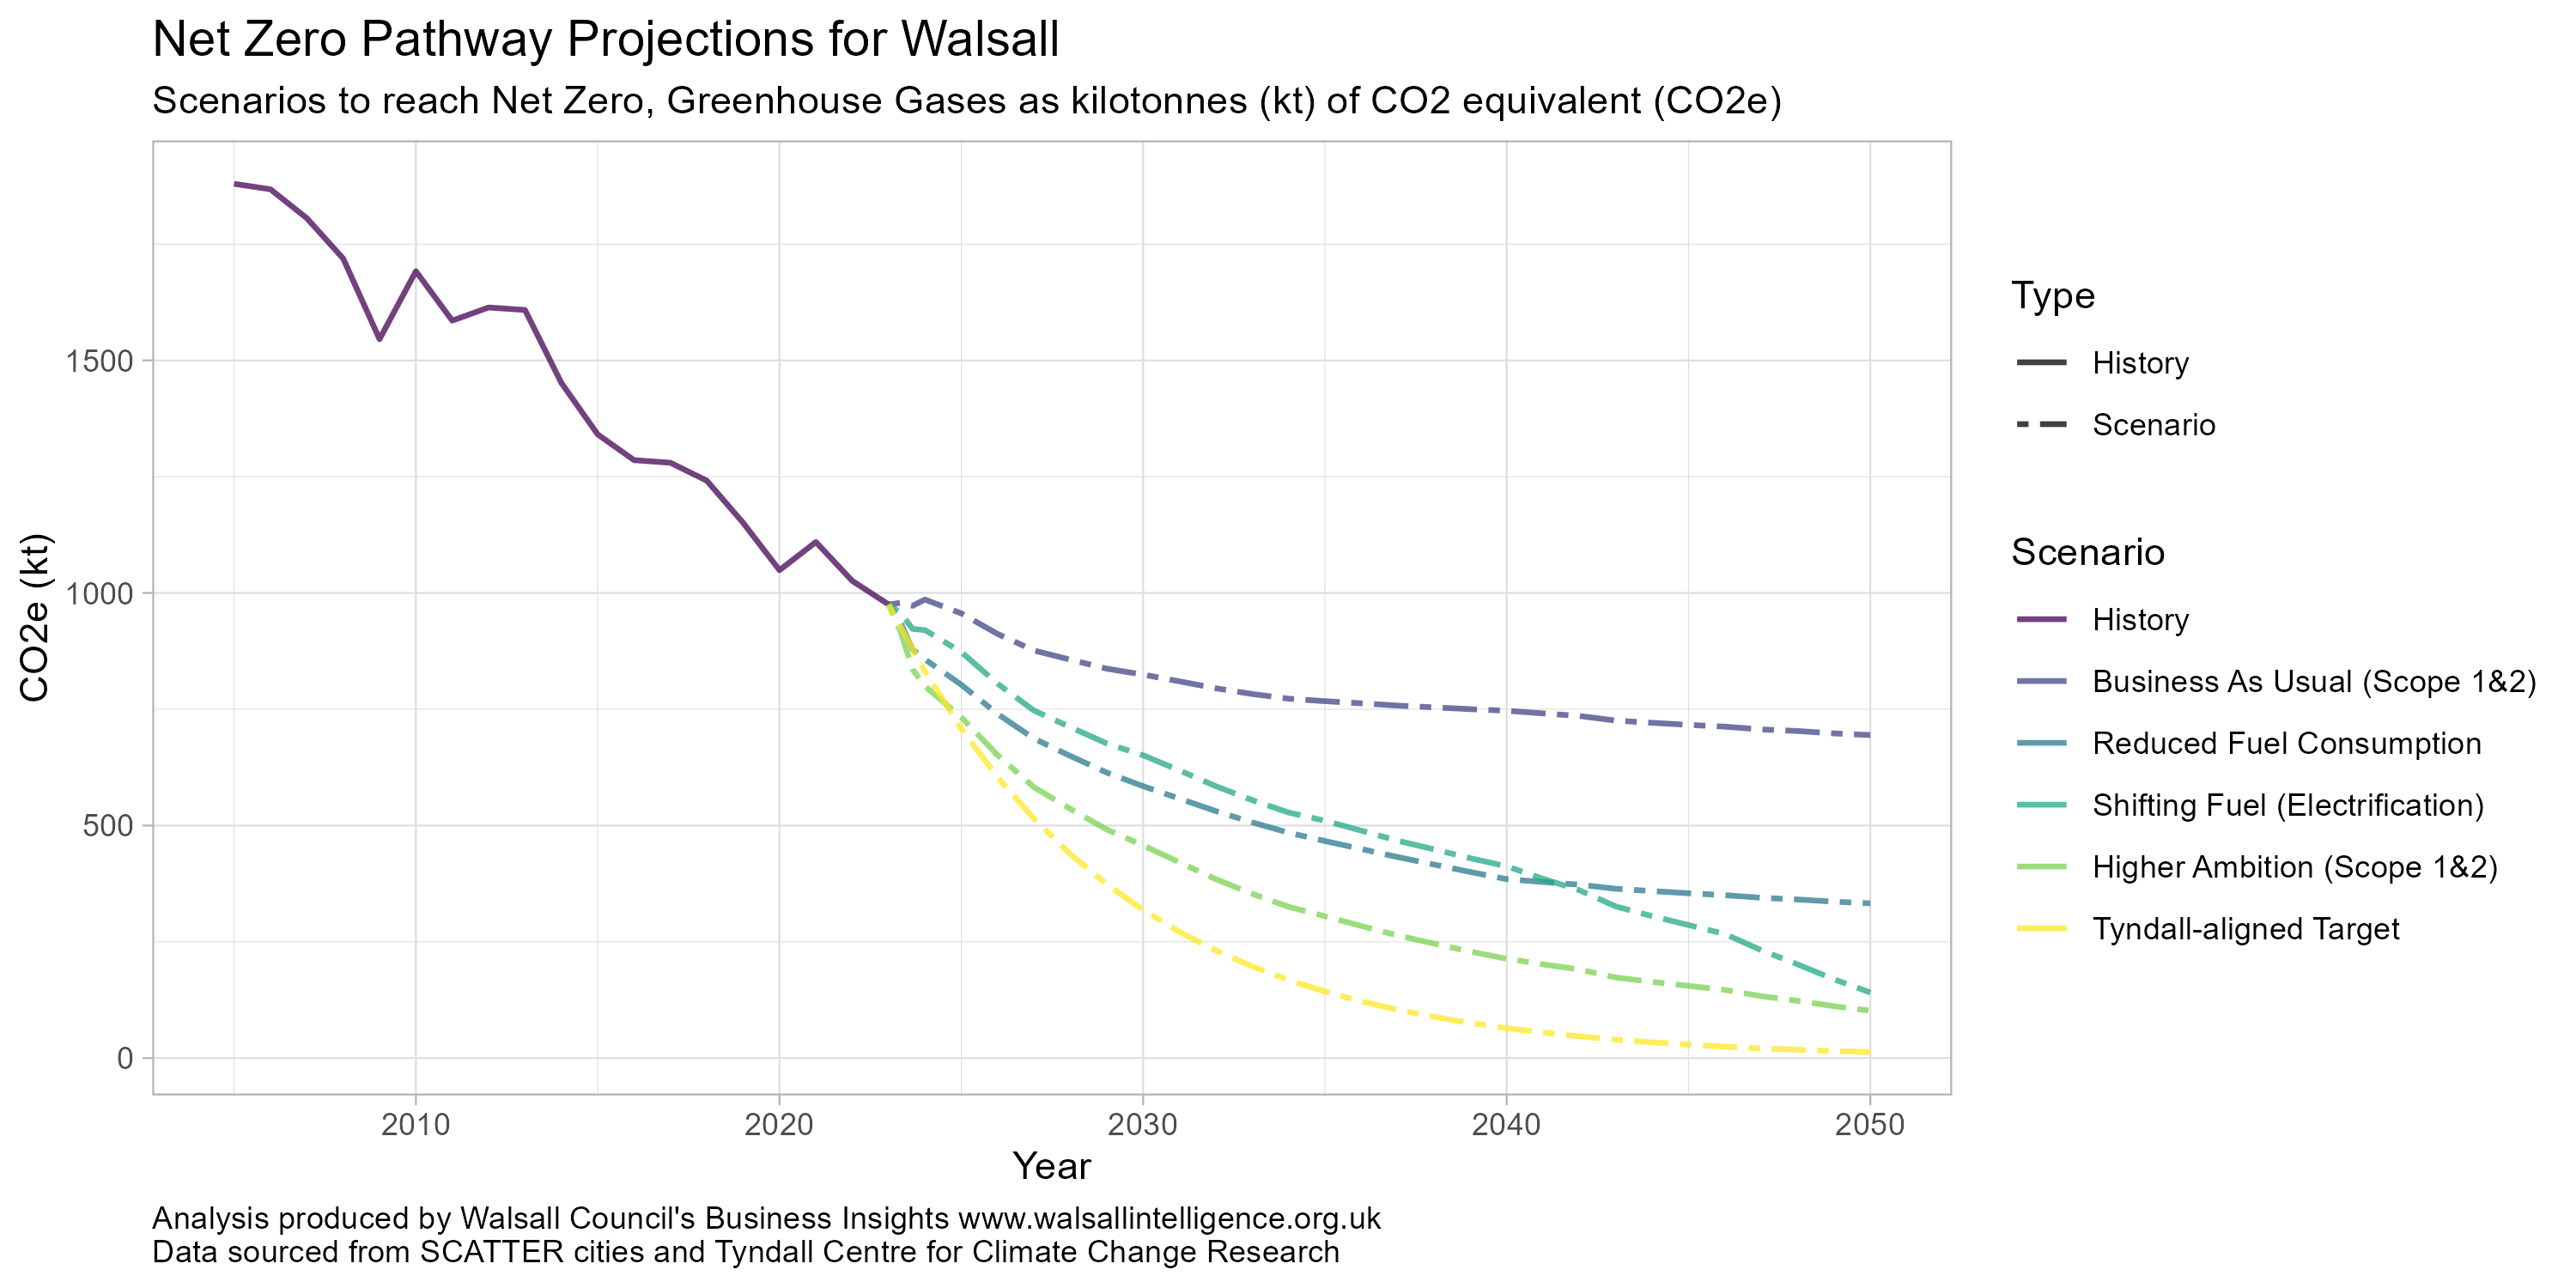
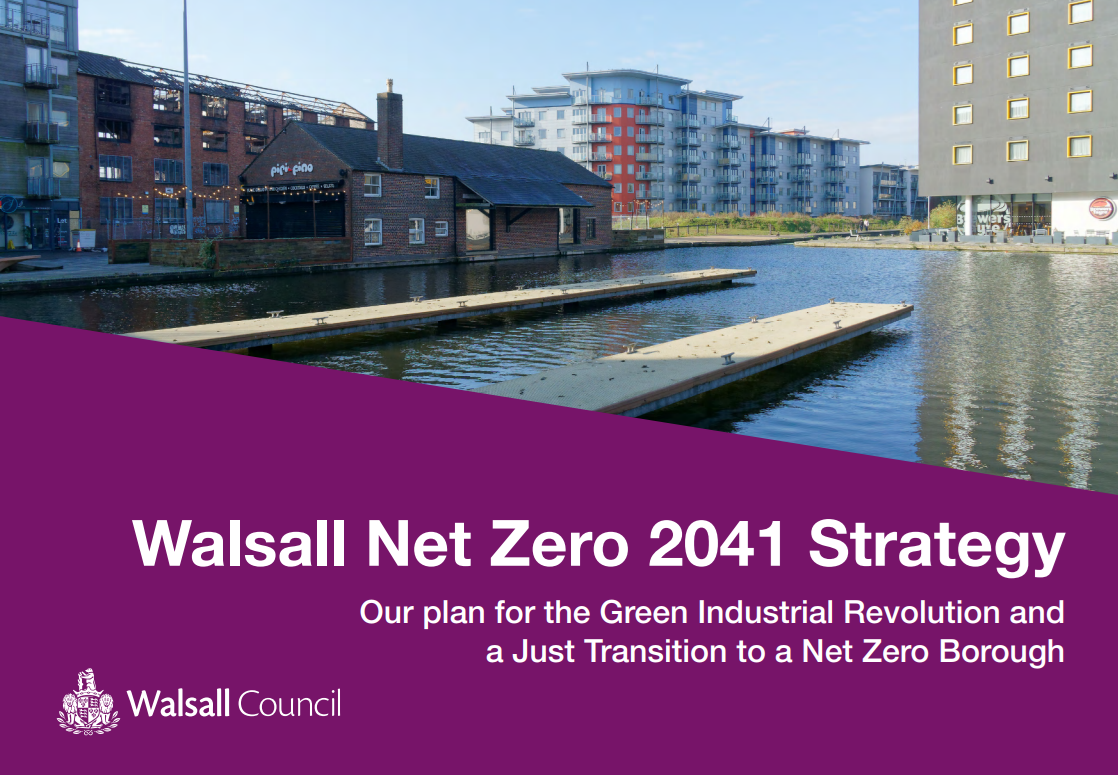
This page will contain various visualisations, statistics and analyses to assess the landscape of Greenhouse Gas Emissions within the Walsall Borough.
It is a work in progress, and more will be added over the coming weeks and months as we explore the area in further detail.
Emissions by Sector
The Department for Energy Security and Net Zero (DESNZ) produces annual estimates for Greenhouse Gas Emissions by Local Authority and Sector. It suggests that Walsall’s largest contributions towards Greenhouse Gas Emissions are from Domestic Sources (34.9%) and Transport (34.2%), with Industry contributing 17.8%. Waste Management, Public Sector and Commercial operations contribute approximately 4% each and, as Walsall is part of the West Midlands conurbation/urban area, Agriculture and LULUCF (Land Use, Land Use Changes and Forestry) contribute the least (1.3% combined).
The long-term trend has seen substantial decreases, with a 40.9% reduction in emissions over 16 years (2005-2021).
Emissions by Source
The Sankey Chart below further breaks down Greenhouse Gas Emission Estimates (Data sourced from DESNZ) into sources, highlighting the principal sources of emissions within each sector. Domestic Gas use, which includes central heating, is the single largest source and contributes 76.5% of all Domestic emissions, and 26.7% of the Borough’s total Emissions. By this measure, Domestic Gas consumption for 2021 was larger than the estimated contribution from industry, public sector and commercial combined (approximately 25%).
Land use, Land use changes and Forestry (LULUCF) accounts for the smallest contribution (0.5%), but is also offset by Walsall’s forest and wooded land, accounting for a 50.3% reduction in net emissions from LULUCF sources.